Diagnosis
To ensure safe and reliable operation of electric vehicles, accurate and timely fault diagnosis of the battery system is essential. Battery system includes three parts: sensors, systems and components and actuators. Internal/external short-circuit fault and thermal runaway early warning of the battery are current research hotspots. BMS should have the ability of fast and accurate detection and fault-tolerant control.
1. Fault types
As shown in Fig. 1, the possible fault types that occur in each part of the battery system after decomposition include actuator fault (BMS hardware fault, contactor fault), system and component fault (internal short circuit fault, external short circuit fault, overcharge fault and over-discharge failure, connection fault, inconsistency fault, insulation fault, thermal management system fault) and sensors fault, where fA(t), fC(t) and fS(t) indicate different types of fault, while w(t) and v(t) are noise. Each type of fault is not independent. The occurrence of one type of fault may cause other one or more types of faults, that is, there is a complex coupling relationship between multiple faults in the battery system, which also brings challenges to the accurate fault diagnosis of the battery system.
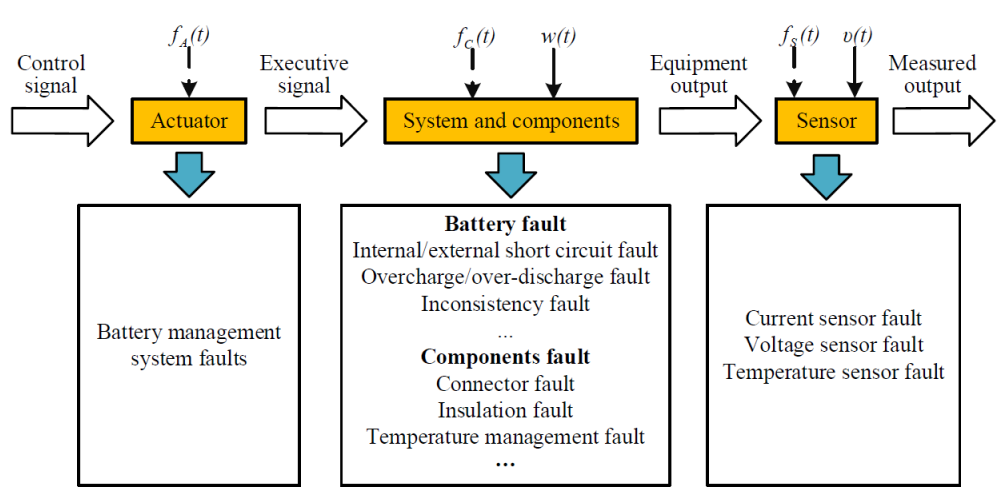
Fig. 1. Battery system decomposition and possible fault types.
2. Battery system fault diagnosis methods
Battery system fault diagnosis methods can be divided into four categories: model-based method, signal processing-based method, data-driven method and knowledge-based method. The flow chart of fault diagnosis of lithium-ion battery system is shown in Fig. 2.
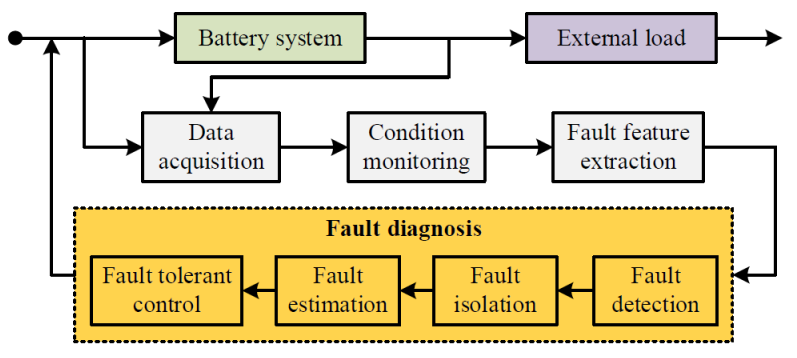
Fig. 2. Fault diagnosis process of battery system.
Model-based method
Model-based fault diagnosis method uses mathematical modeling of the battery to obtain parameters carrying fault information, usually a set of residual signals, which is compared with the fault threshold to determine whether the system is faulty.
Signal processing-based method
When a battery fault occurs, the fault information will be carried out in data collected by sensors. The fault analysis can be conducted directly from the test data (time-domain analysis). As the amplitude-frequency and phase-frequency characteristics of the test data obtained in the case of battery fault occurs will change to some extent, spectrum analysis of the data can also be carried out in frequency domain to determine the status of battery system. Fourier transform is an important data time-frequency transform tool, but it cannot meet the demand of non-steady-state signal changes. Wavelet transform can overcome the shortcoming that the window size does not change with the frequency in Fourier transform, and carry out multi-scale detailed analysis of the unsteady signal to achieve the purpose of refining small fault information in fault signal, so it is widely used in fault diagnosis research of the battery system. For lithium-ion batteries, the reaction at the SEI dominants in the low frequency range, charge transfer and double layer process dominant in the high frequency range, and the diffusion process is mainly in the higher frequency band.
Knowledge-based method
Machine learning and expert systems are typical knowledge-based fault diagnosis methods. The former constructs an artificial neural network to establish a fuzzy inference relationship between fault feature and a specific fault type, and takes the real-time data collected in battery working process as input, then the output is possible fault type. The key of this method is to establish the fuzzy inference relationship between fault data and fault type, so a large number of accurate fault data should be used to train the model first, and the accuracy of the fault diagnosis results depends heavily on the training results of the model. Fig. 11 illustrates the flow chart of knowledge-based fault diagnosis method. Another typical application of knowledge-based methods is to use it in battery life prediction. By establishing a machine learning algorithm and training it with aging data, the future aging trajectory can be predicted based on the historical aging data of the battery.
Expert system is an effective fault diagnosis method, mainly consists of knowledge base, inference machine and human-machine interface. Different from the machine learning method, the expert system not only needs to establish the fuzzy inference relationship between fault features and fault types, but also needs to use the historical operation data and the corresponding relationship between fault features and fault causes to build a rich knowledge base, and continuously improve it in the subsequent fault diagnosis process.
Data-driven method
Theoretically, the cells in battery system should have good consistency, and the voltage of cells in battery system under same condition should follows a certain distribution. Therefore, the methods based on information entropy, local outlier factor and correlation coefficient can be used to accurately detect abnormal data, so as to detect whether a fault occurs. However, the above methods can only detect abnormal cell according to cell voltage measurements in battery system, but cannot determine the specific fault type.
In addition to the above four kinds of fault diagnosis methods, other methods have also been applied to the fault diagnosis of battery system, such as hardware redundancy , joint parameter judgment, capacity incremental analysis (ICA) and system reliability analysis, etc.
3. Sensor fault diagnosis and fault tolerance
BMS relies on the current, voltage and temperature signals measured by the sensors in real time to complete the functions of state estimation, balance control, thermal management, fault diagnosis, optimized charging and so on. When the current sensor’s noise is too big or the sensor fails, it will cause large estimation errors in parameters, SOC, SOH and SOP. When the voltage sensor fails, it will not only increase the state estimation error, but also cause overcharge or over-discharge. In addition, the battery has upper and lower safety cut-off voltages. The failure of the voltage sensor will also cause the missing alarm when the battery fails or the false alarm when the battery is working normally. Therefore, it is necessary to carry out research on sensor fault diagnosis of the battery system. In particular, after realizing the sensor fault detection and fault isolation of the battery system, necessary fault tolerance needs to be performed to realize the robust multi-state estimation of the battery.
Model-based fault monitoring, isolation and identification method
Fig. 3 shows sensor fault diagnosis process of the series battery pack.
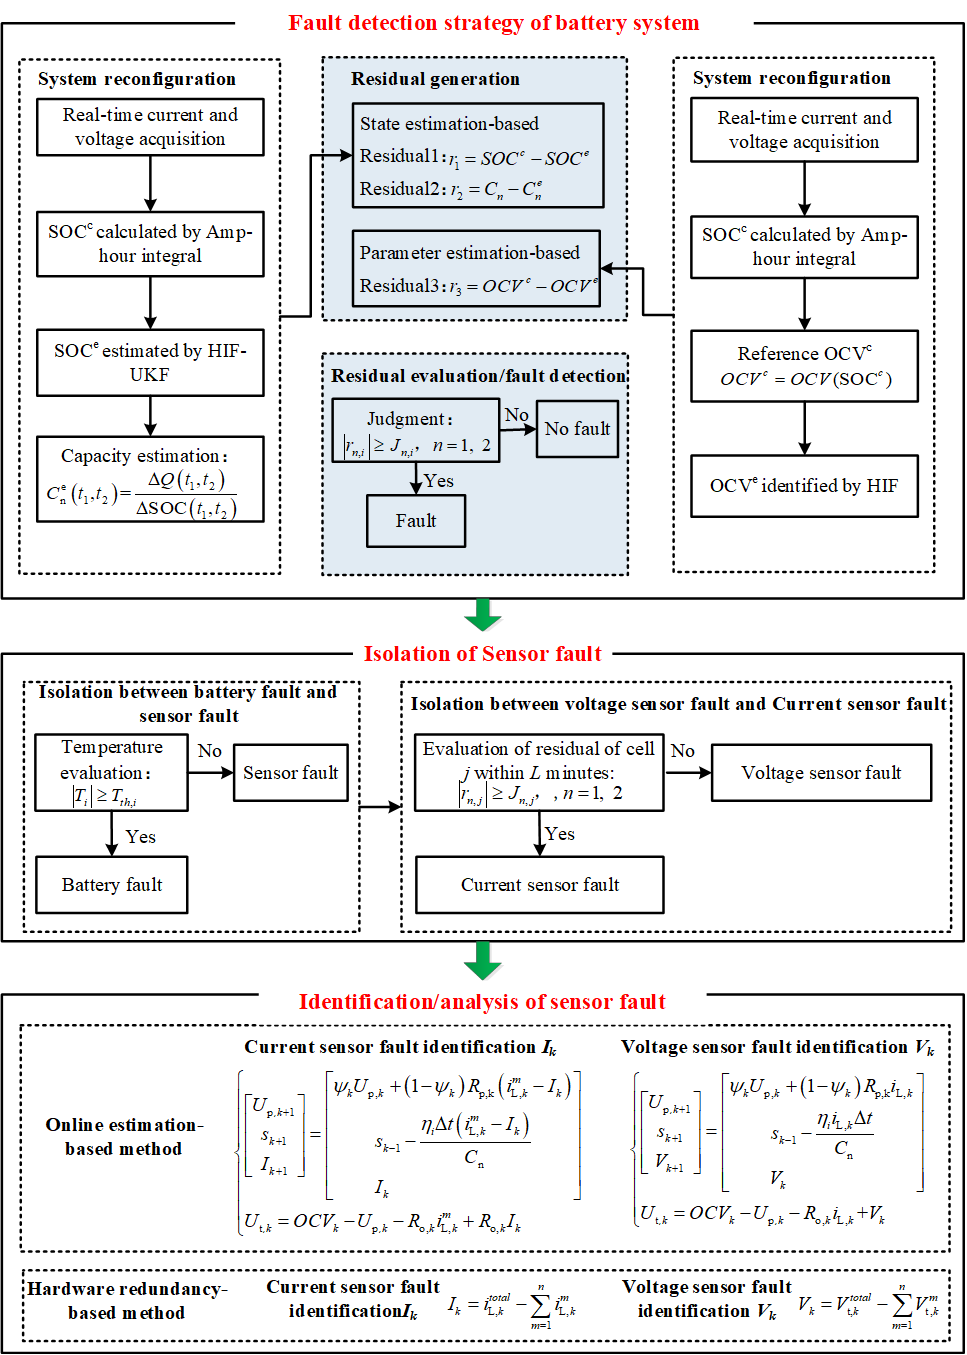
Fig. 3 Sensor fault diagnosis process of the series battery pack
Sensor fault tolerance control and multi-state estimation and correction
The fault tolerance control of the sensor is based on fault detection and diagnosis. According to different fault sources and characteristics, corresponding fault tolerance control measures are taken to ensure the normal operation of the system. For batteries, after completing fault identification, various functions (especially multi-state estimation) of BMS can be restored to normal through fault compensation or correction. And reliable estimation of multi-state estimation can be realized.
The method based on online identification and hardware redundancy can realize online calculation of sensor fault. But the method based on online estimation can also correct the SOC while identifying the fault. The method based on redundancy only calculates the sensor fault. And the SOC estimation correction of the sensor needs to be further carried out.
For current sensor faults, the following state space equation is established:
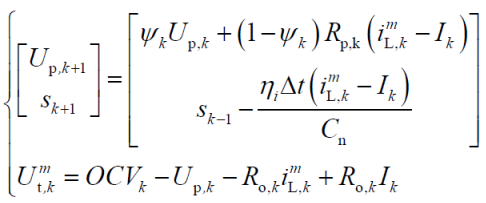 | (1) |
For voltage sensor faults, the following state space equation is established:
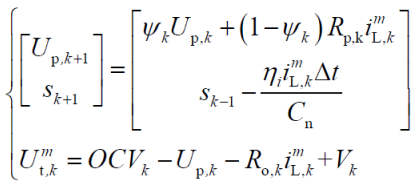 | (2) |
Using filter algorithms for equations (1) and (2) respectively can realize the online estimation and correction of SOC.
Although the online estimation-based method and the hardware redundancy-based fault identification method are different from the SOC correction method, the capacity correction expressions after obtaining the fault information through the two methods are the same. For current sensor faults, the capacity update formula is as follows:
 | (3) |
For voltage sensor failure, the capacity update formula is as follows:
 | (4) |
After obtaining the SOC, capacity correction value and sensor fault information, the peak current and power need to be corrected online. The discharge peak current and power can be updated according to formula (5) and formula (6): what needs to be pointed out is that the values contained m in the superscript are obtained from the measurement data containing the sensor fault information.
 | (5) |
| (6) |
4. Case analysis
Taking the battery pack composed of NMC03 and NMC04 in series as an example, the measurement data of each sensor under the UDDS working condition at 25℃ is shown in Fig. 4. Due to the inconsistency of the cells, the temperature curves are not overlapped, but the readings of the two temperature sensors are still changing between 25℃ and 30℃ with changes in current ratio and voltage.
To simulate the faults occurring in the current and voltage sensors, a 0.5 A deviation was applied to the current data of the UDDS operating condition from the 60th minute. A 0.25 V deviation was applied to the voltage data of the NMC03 battery from the 60th minute.
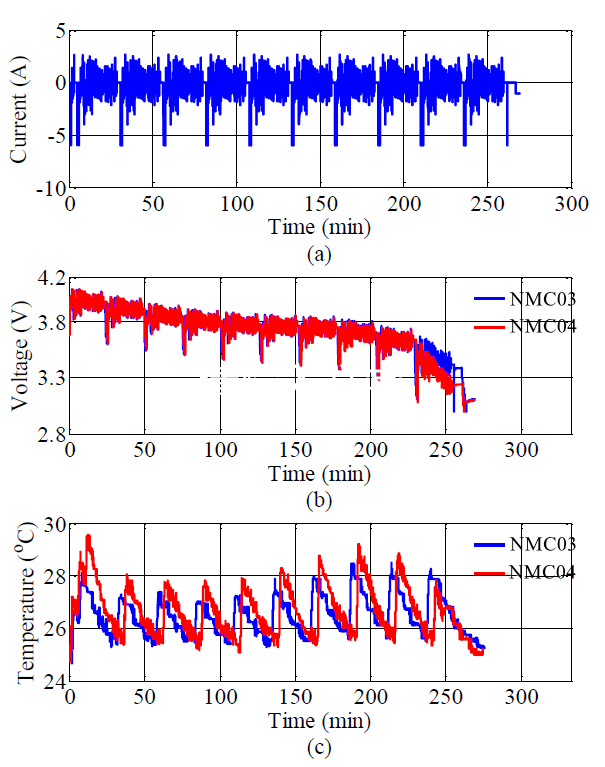
Fig. 4 UDDS test profiles: (a) current, (b) voltage, (c) temperature.
Sensor fault detection and isolation results
(1) Sensor fault detection and isolation results with SOC estimation errors as residual
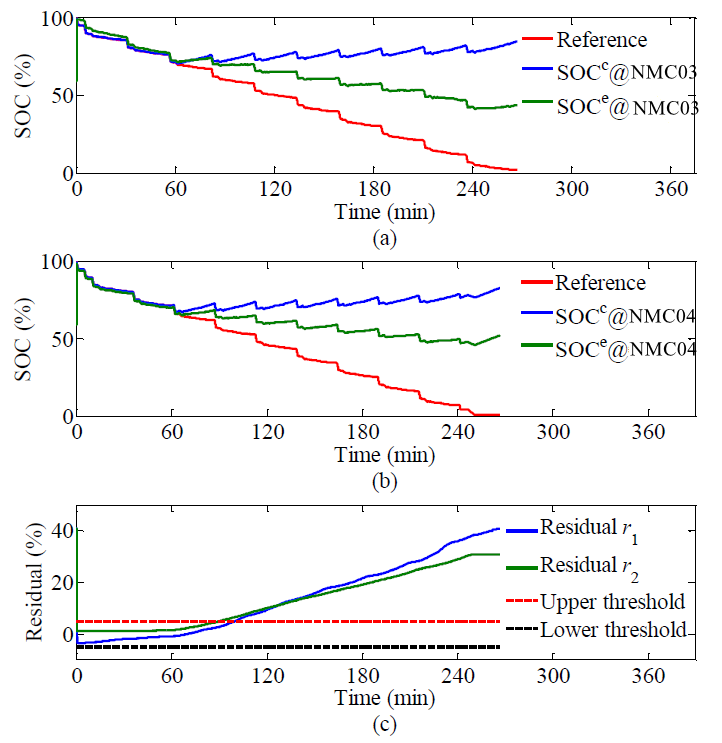
Fig. 5 Results under current sensor fault: (a) SOCs of NMC03; (b) SOCs of NMC04; (c) residuals.
Fig. 5 shows results under current sensor fault. The scheme uses the SOC estimation errors as the residual. Fig. 5 (a) shows the SOC calculation result of the ampere-hour integral method and the FFRLS-UKF joint estimation method of the NMC03 cell, where the reference SOC is the ampere-hour integral calculation result when the current sensor fault is not applied.
Fig. 5 (b) depicts the SOC results of different methods of NMC04 cell. Fig. 5 (c) shows the residual results of the two cells. The residual of NMC04 cell exceeds the upper threshold when it is close to 90 minutes. At this time, a fault warning signal should be given. At this time, the difference of the NMC04 cell’s and the NMC03 cell’s temperature is 10℃. And the temperature has not risen rapidly before. If it is not the battery fault, the fault should be sensors fault. After 10 minutes (L=20), the residual of the NMC03 cell also exceeds the upper threshold. At this time, it can be judged that the fault is caused by the current sensor.
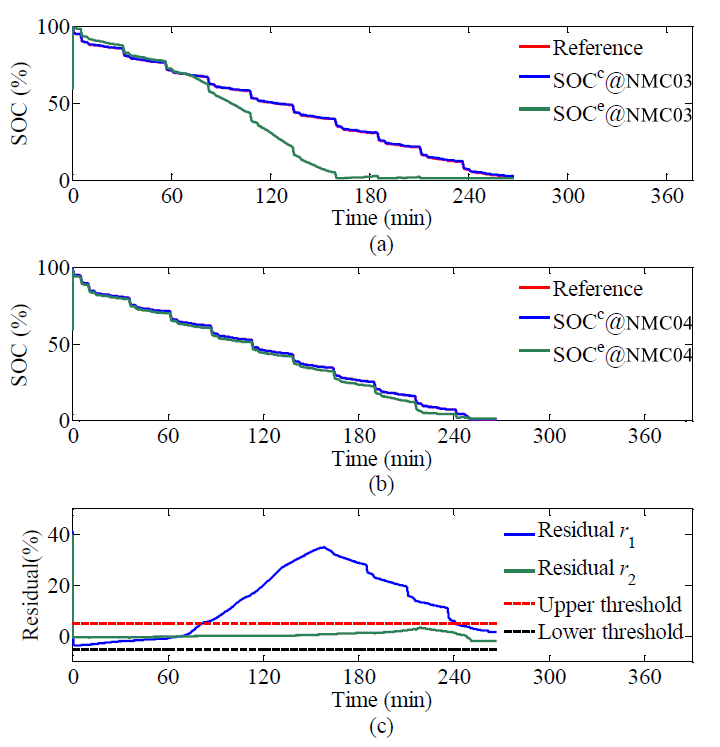
Fig. 6 Results under voltage sensor fault: (a) SOCs of NMC03; (b) SOCs of NMC04; (c) residuals.
Fig. 6 shows results under voltage sensor fault. The scheme also uses the SOC estimation errors as the residual. Fig. 6 (a) shows the SOC calculation results of the ampere-hour integration method and the FFRLS-UKF joint estimation method of the NMC03 cell, where the reference SOC is the ampere-hour integral calculation result when the current sensor is not applied. Fig. 6 (b) depicts the SOC results of different methods of the NMC04 cell. Fig. 6 (c) shows the residual results of the two cells. The residual of the NMC03 cell exceeds the upper threshold when it is close to 81 minutes. At this time, a fault warning signal should be given. At this time, the difference of the NMC03 cell’s and the NMC04 cell’s temperature is 10℃, and the temperature has not risen rapidly before. If it is not the battery fault, the fault should be sensors fault. In the following 20 minutes, the residual of the NMC04 cell still did not exceed the upper threshold. At this time, it can be judged that the fault is caused by the voltage sensor connected to the NMC03 cell.
(2) Sensor fault detection and isolation results with capacity estimation errors as residual
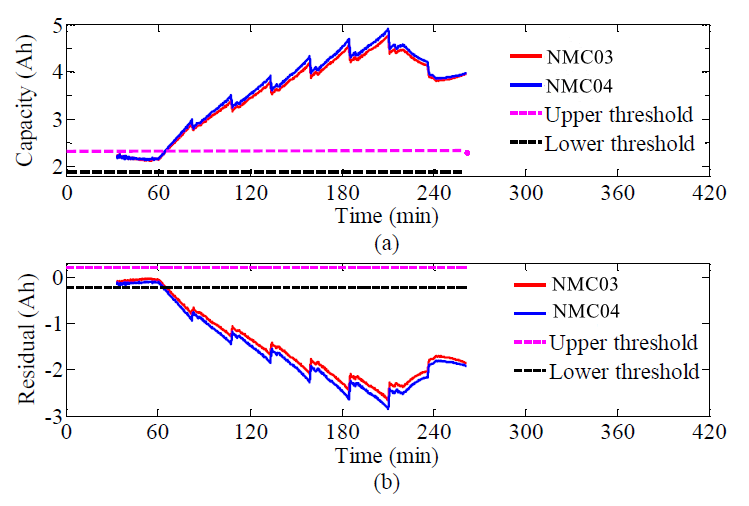
Fig. 7 Results under current sensor fault: (a) capacities; (c) residuals.
Fig. 7 shows the sensor fault diagnosis results with the capacity estimation errors as the residual when the fault is caused by the current sensor. The capacity residual of the NMC03 cell exceeds the upper threshold at 62.5 minutes. At this time, a fault warning signal should be output, which is the same as when the SOC estimation error is used as the residual. After excluding the battery fault by the temperature, it is determined that the fault is caused by sensors. Then the residual of the NMC04 cell also exceeds the upper threshold at 64.5 minutes (L=10). At this time, it can be determined that the fault is caused by the current sensor.
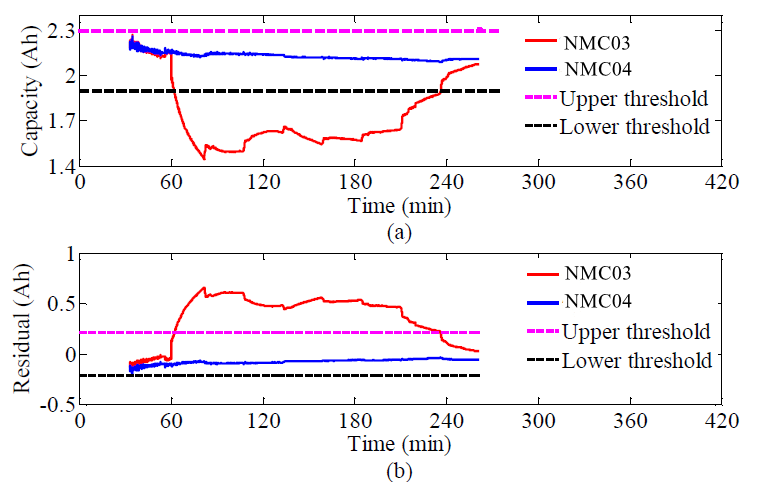
Fig. 8 Results under voltage sensor fault: (a) capacities; (c) residuals.
When the fault is caused by the voltage sensor, the accumulated power calculated based on the ampere-hour integration method is not affected, while the SOC based on the FFRLS-UKF joint estimation is affected, which causes the estimated capacity and residual of the relevant battery to exceed the threshold. The capacity residual of the NMC03 cell exceeds the upper threshold at 61.8 minutes. At this time, a fault warning signal should be output. After excluding the battery fault by the temperature, it is determined that the fault is caused by sensors. If the residual of the NMC04 cell doesn’t exceed the upper threshold in the next L minutes, it can be determined that the fault is caused by the voltage sensor of the NMC03 cell. The results under voltage sensor fault are shown in Fig. 8.
(3) Sensor fault detection and isolation results with OCV estimation errors as residual
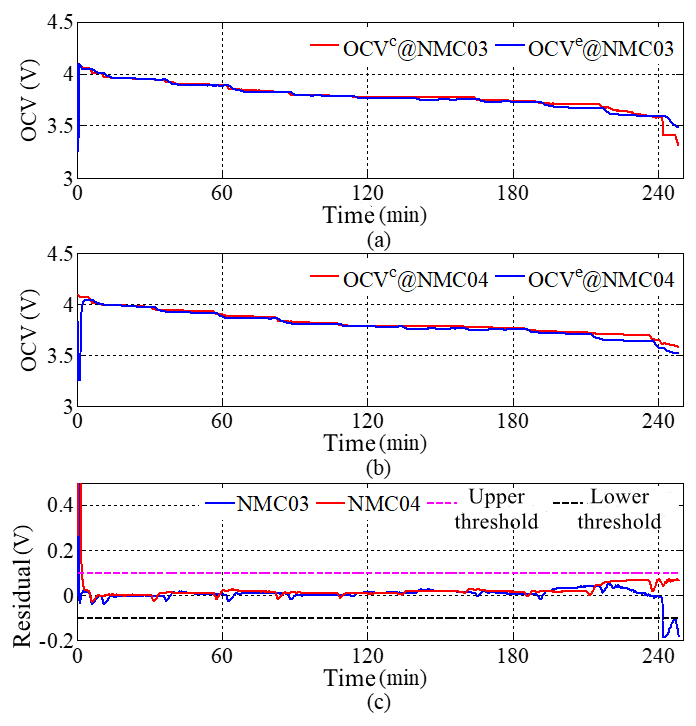
Fig. 9 Results under no fault: (a) reference and estimated value of NMC03; (b) reference and estimated value of NMC04; (c) residuals.
Fig. 9 shows the OCV reference value OCVc and estimated value OCVe when there is no sensors fault. It can be seen that when the algorithm starts to run, the estimated OCV converges from the inaccurate initial value to the reference value quickly. At the end of discharge (SOC<10%) , the residual of the NMC03 cell exceeds the lower limit of the threshold, which is due to the OCV itself at low SOC is not accurate, so this method is suitable for fault diagnosis in the 10%~100% SOC range.
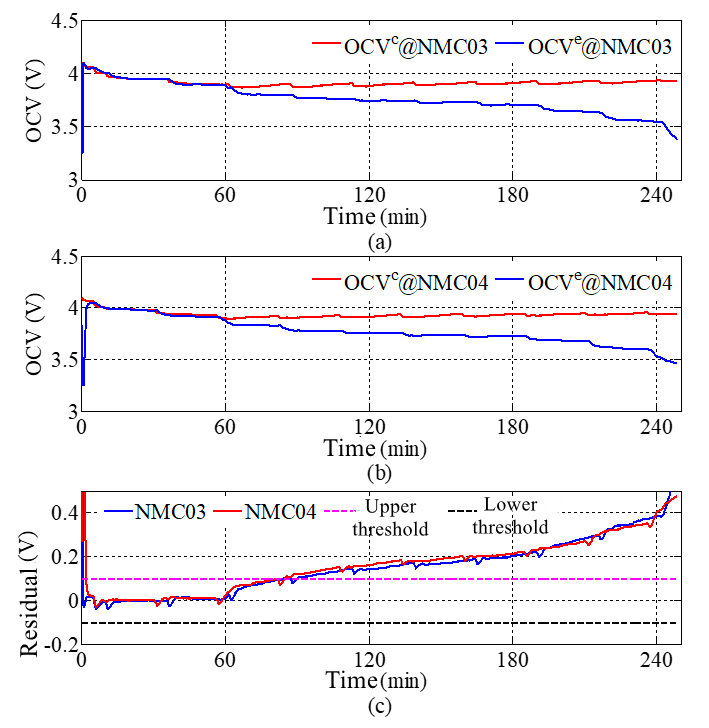
Fig. 10 Results under current sensor fault: (a) reference and estimated value of NMC03; (b) reference and estimated value of NMC04; (c) residuals.
Fig. 10 shows the OCV reference value, estimated value and OCV estimation error (residual) of two cells when the fault is caused by the current sensor at the 60th minute. It can be seen from the figure that under sensors fault the residuals of the NMC03 cell and the NMC04 cell begin to increase. At 81 minutes, the residual of the NMC04 cell first exceeds the upper threshold, and the system should give a fault warning at this time, which is similar to the residual generation method based on the state estimation. It is observed that the temperature reading of the NMC04 cell still doesn’t exceed the threshold. Excluding the NMC04 cell fault, it can draw the conclusion that the fault is caused by sensors. In order to further determine whether the source of the fault is the current sensor or the voltage sensor, continuing to observe for 10 minutes (L=10), at 84 minutes, the residual of the NMC03 cell also exceeds the upper threshold. It is concluded that the fault is caused by the current sensor.
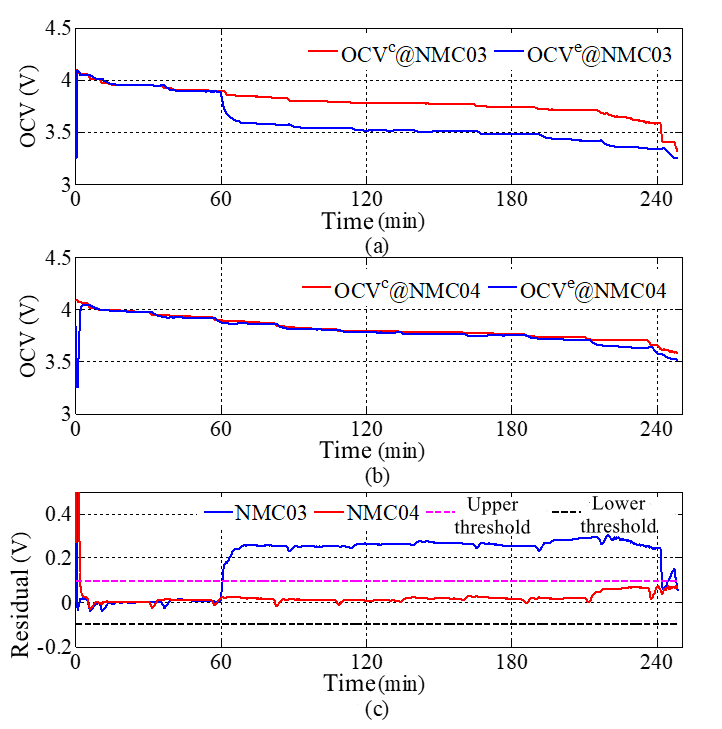
Fig. 11 Results under current sensor fault: (a) reference and estimated value of NMC03; (b) reference and estimated value of NMC04; (c) residuals.
Fig. 11 (a) and (b) respectively show the OCV reference value and estimated value of the two cells when the fault is caused by the voltage sensor connected to the NMC03 cell at the 60th minute. Fig. 11 (a) shows the OCV estimate error (fault residual). It can be seen from the figure that when the sensor fails, the residual of the NMC03 cell increases rapidly. At 60.8 minutes, the residual of the NMC03 cell first exceeds the upper threshold. At this time, the system should give a fault warning, which is similar to the residual generation method based on the state estimation. It is Observed that the battery temperature reading of the NMC03 still doesn’t exceed the threshold. Excluding the NMC04 cell fault, it can draw the conclusion that the fault is caused by sensors. In order to further determine whether the fault source is the current sensor or the voltage sensor, we continue observing for 10 minutes (L=10). During the entire L minutes, the residual of the NMC04 cell has been within the threshold range. It is concluded that the fault is caused by the voltage sensor connected to the NMC03 cell.
Sensors fault identification results
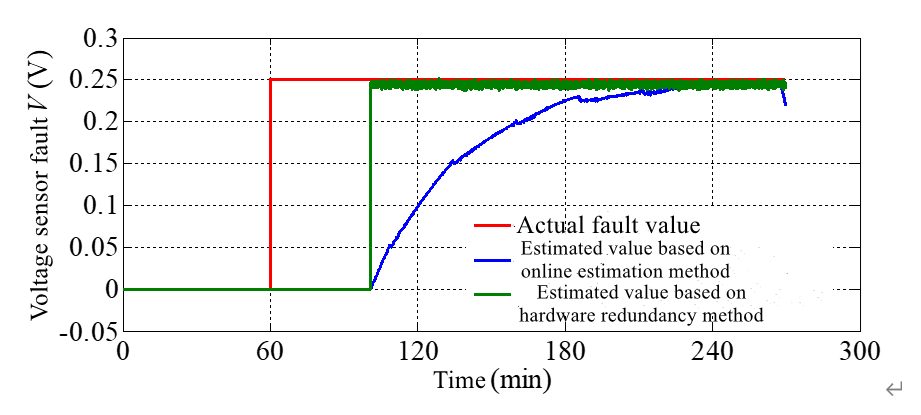
Fig. 12 Results of sensor fault identification under voltage sensor fault
Fig. 12 shows the fault results obtained by the two fault methods when the SOC estimation error is used as the residual for fault detection and isolation when the voltage sensor fault occurs. It can be seen from Fig. 12 that the voltage sensor has a 0.25 V bias fault at the 60th minute. Fig. 12 shows that the fault was detected within the 81st minute, but the fault isolation was at 101st minute. Through the hardware redundancy method, the fault can be obtained within a few seconds. Because of the covariance noise measured by the sensor, the fault value is not completely consistent with the actual fault value.
Sensors fault tolerance control and state estimation correction results
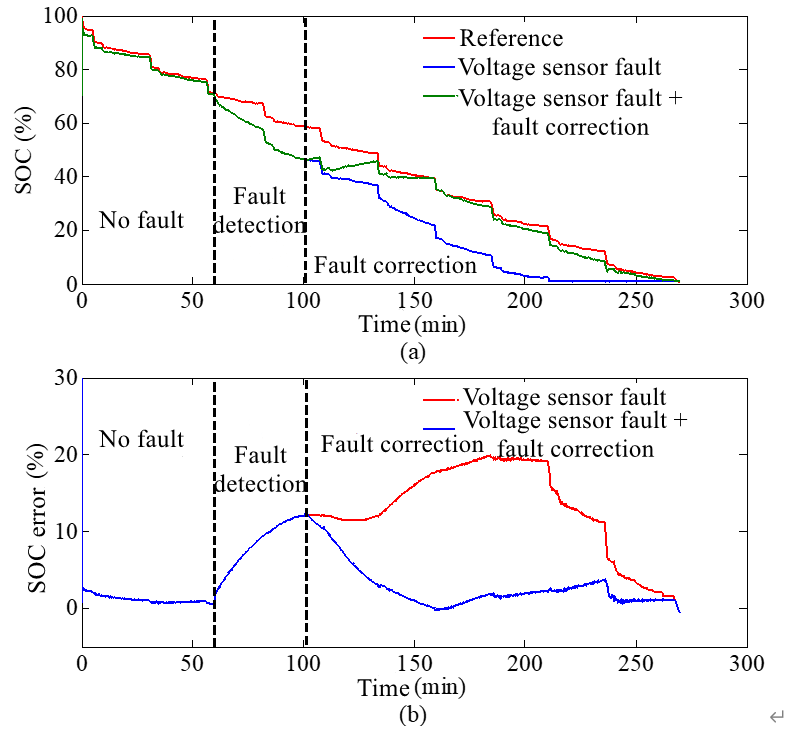
Fig. 13 Results of fault correction under voltage sensor fault: (a) SOCs; (b) residuals.
Fig. 13 (a) shows the estimated SOC values of the NMC03 cell in the phases of no fault, fault detection and isolation, and fault identification. Among them, the fault identification stage is a fault correction process for SOC estimation. When there is no fault, the estimated SOC value is very close to the reference SOC. The voltage sensor fault is injected at the 60th minute. When the SOC estimation error is used as the residual for fault detection, the fault is detected at the 81st minute. But for further confirmation whether it’s the voltage sensor fault or not, we observed the NMC04 cell’s residual in the next 20 minutes. At the 101st minute, the NMC04 cell’s residual did not exceed the threshold. It is finally determined that the fault is caused by the voltage sensor. The SOC estimation value at this stage is getting farther and farther from the SOC reference value, that is, the SOC estimation error is getting bigger and bigger. Then the fault is identified and the estimated SOC value is corrected at the same time. The estimated SOC value begins to approach the reference SOC value. After that, the SOC estimation error has been controlled within 5%.
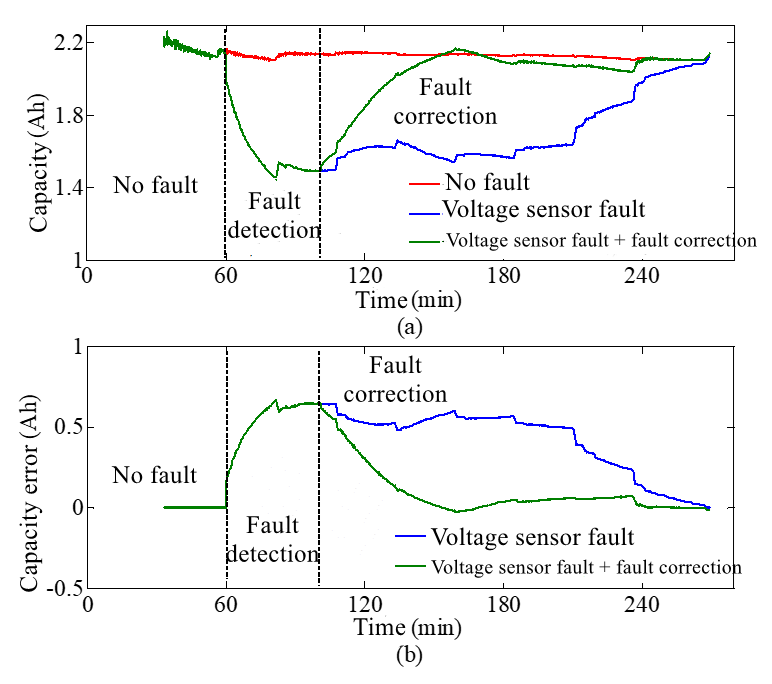
Fig. 14 Results of fault correction under voltage sensor fault: (a) capacities; (b) residuals.
When the fault is caused by the voltage sensor, the estimated correction value of SOC shown in Fig. 13 and the estimated value of the sensor fault obtained based on the online estimation method in Fig. 12 can be used to perform the capacity estimation correction in the multi-state joint estimation. The estimation results are shown in Fig. 14. When the sensor fail is identified, the SOC (as shown in Fig. 12) of the battery is gradually corrected online, which will gradually affect the SOC difference within a certain period of time. And the difference will gradually become accurate as the sampling time increases, that is, the influence of the sensor fault is gradually reduced, which in turn allows the capacity estimation to be corrected online.
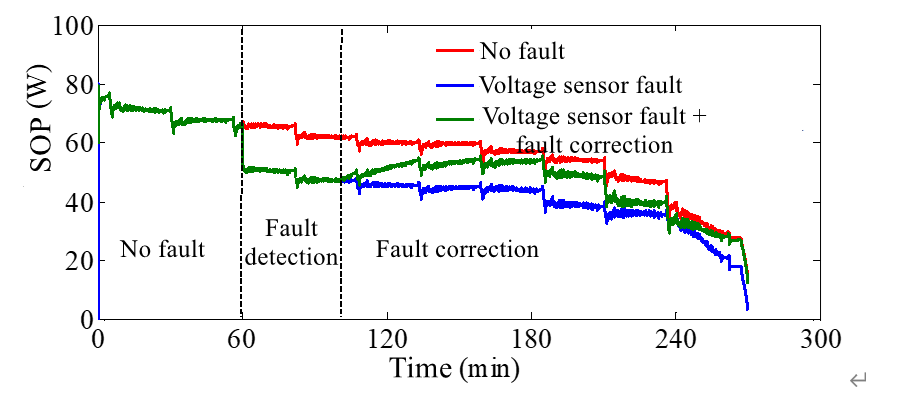 Fig. 15 Results of fault correction under voltage sensor fault
While the SOC and capacity are corrected, the peak power SOP can also be corrected. Fig. 15 shows the online correction result of the instantaneous peak power SOP of the multi-constraint dynamic method based on the identified sensor fault Vk and the synchronized corrected SOC estimation when the fault is caused by the voltage sensor. When the fault is caused by the voltage sensor, the peak power SOP quickly deviates from the peak power value when there is no fault. After completing the fault detection and isolation, the SOP will gradually close to the SOP trajectory when there is no fault at the 101st minute according to the estimated value of the voltage sensor fault and the SOC correction value. But there is always a certain correction error. The error may be related to a certain error in the low SOC after the SOC is corrected.
5. References
[1] R. Xiong. Core Algorithms of Battery Management System. Beijing:China Machine Press,2018. (Chinese) (Chapter Seven)
[2] R. Xiong, W. Sun, Q. Yu* and F. Sun, “Research progress, challenges and prospects of fault diagnosis on battery system of electric vehicles”, Applied Energy, vol. 279, pp.115855, Dec 2020. (Download)
[3] R. Xiong*, Y. Pan, W.X. Shen, H. Li and F. C. Sun, “Lithium-ion battery aging mechanisms and diagnosis method for automotive applications: Recent advances and perspectives”, Renewable and Sustainable Energy Reviews, vol. 131, pp. 110048, Oct 2020. (Download)
[4] R. Xiong*, S. Ma, H. Li, F. Sun and J.Li, “Towards a Safer Battery Management System: A Critical Review on Diagnosis and Prognosis of Battery Short Circuit”, iScience, vol. 23, no. 4, pp. 101010, Apr 2020. (Download)
6. Available Resources
(1) Fault diagnosis data: click to download (PDF watermark textbook)


